The Ledger · Property

What Is a Good DSCR for a Rental Property?

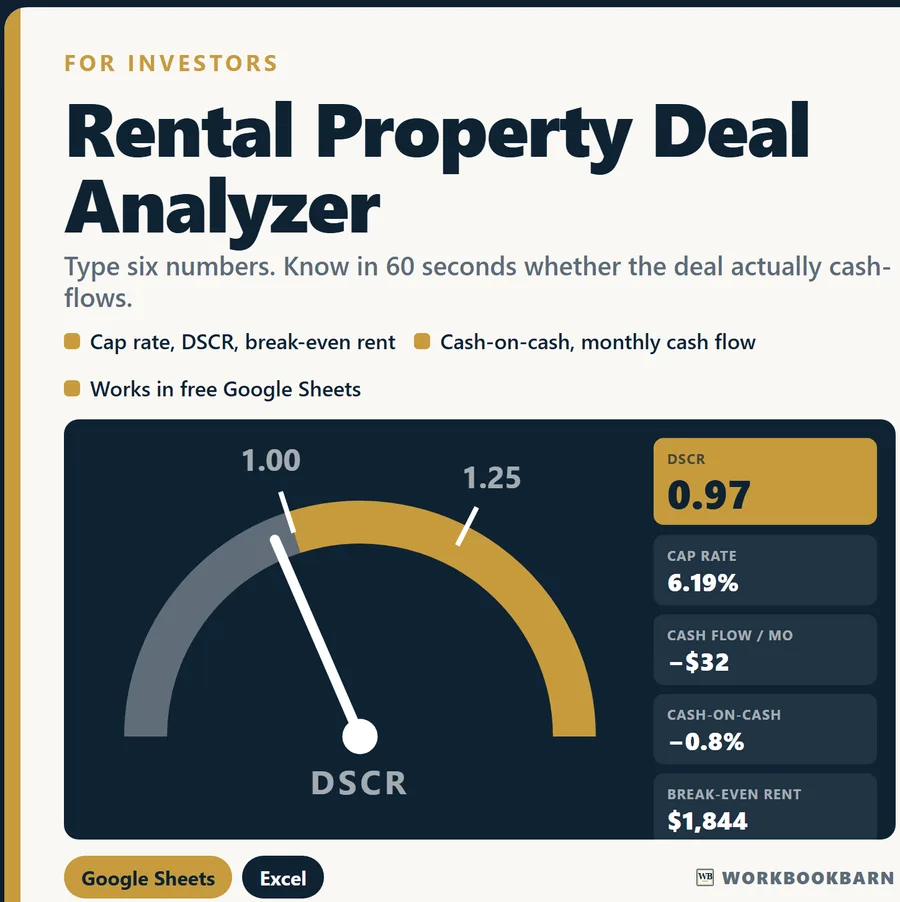
DSCR is net operating income divided by annual debt service; 1.0 is break-even, one federal program requires 1.15, and the seeded deal in our analyzer lands at 0.97.

DSCR is net operating income divided by annual debt service, and the number that matters structurally is 1.0 — below it, the property does not earn enough to make its own mortgage payment. Lenders set their floor above that: the USDA’s Section 538 rural rental housing program requires at least 1.15 by regulation, and commercial and DSCR lenders commonly screen at 1.25. The seeded deal inside our Rental Property Deal Analyzer comes out at 0.97, and this page shows every number that got it there.

Almost every DSCR explainer online is written by someone selling the loan, and they all use an example that passes. That is the least useful example there is. A deal that passes teaches you nothing about where the ratio breaks, so the worked example below is one that fails — a $200,000 rental at a 6.2% cap rate, which sounds fine, priced at a rent the deal cannot actually carry. The gap is $32.48 a month, which is exactly the size of gap a listing pro forma is good at hiding.

What is a good DSCR for a rental property?

Anything at or above 1.0 covers the mortgage payment; lenders want a cushion above that, and at least one federal rental-housing program sets its minimum at 1.15 by rule.

There is no single legal definition of “good,” because the floor is set by whoever is lending. One threshold is written into federal regulation and can be read directly: for the Section 538 Guaranteed Rural Rental Housing Program, the lender must certify that the project’s cash flow assumptions “depict compliance with the section 538 program’s debt service coverage ratio requirement of at least 1.15.” That language is 7 CFR § 3565.303(b)(2), published by the U.S. Government Publishing Office on GovInfo in the 2024 edition of the Code of Federal Regulations.

Outside that program the numbers are underwriting policy rather than law, and they move with the lender, the asset and the year. The Rental Property Deal Analyzer screens against 1.25, which is the level commercial and DSCR lenders most often ask for — it means the property earns 25% more than the payment. What is worth internalising is the structure, not the threshold: 1.0 is break-even, everything above it is the cushion that absorbs a vacancy, and everything below it is a shortfall you pay out of pocket every month.

How do you calculate DSCR?

Divide net operating income by annual debt service. NOI is income after vacancy and after every operating expense, but before the mortgage; debt service is twelve monthly principal-and-interest payments.

The trap is in what NOI excludes. NOI is calculated before debt service, so the mortgage never appears in it — but it is calculated after vacancy, maintenance, CapEx reserve, management, taxes and insurance, which is precisely where a seller’s pro forma likes to put zeroes. Set vacancy to 0% and drop the CapEx line and you can lift NOI by a few thousand dollars without touching the rent, which lifts DSCR straight through 1.0 on paper while the property carries on being short.

This is the arithmetic the analyzer runs, written out. The debt service line itself comes from a PMT function, which is the same function in Excel and in free Google Sheets:

DSCR (F23) = NET OPERATING INCOME (F15) / ANNUAL DEBT SERVICE (F16)

ANNUAL DEBT SERVICE (F16) = 12 x PMT(rate/12, years x 12, -loan amount)
NET OPERATING INCOME (F15) = EFFECTIVE GROSS INCOME (F13) - operating expenses
EFFECTIVE GROSS INCOME (F13) = GROSS SCHEDULED INCOME (F11) x (1 - vacancy rate)

What does the DSCR formula look like on a real deal?

It looks like a chain of five numbers, and the ratio is only the last link. Here is the seeded deal that ships inside the workbook, cell by cell.

Seeded figures from the Rental Property Deal Analyzer, rebuilt in a calculation engine and compared against values worked out independently in code. 15 of 15 figures agreed.

Run the last division and the ratio falls out: 12,384 divided by 12,773.81 is 0.9695, which the sheet reports as 0.97. The property earns about 97 cents for every dollar of mortgage payment. The missing three cents is the -$32.48 a month in F20, and the reason the annual figure is -$389.81 rather than a round number is that the rent is not the only thing that does not divide evenly.

Why does a 6.2% cap rate deal still fail the DSCR test?

Because cap rate ignores the loan entirely. It divides NOI by price, so two buyers paying wildly different financing get the identical cap rate on the same building.

In this deal the loan and the down payment add to a $200,000 purchase (F5 plus F6), and $12,384 of NOI against $200,000 is the 6.2% in F21. That number is a property statistic. DSCR is a financing statistic: it asks whether this particular loan, at this particular payment, fits inside that same NOI — and $12,773.81 of annual debt service does not fit inside $12,384 of income. Same building, same rent, same year; one metric says respectable and the other says short.

The 1% rule in F24 makes the same point from the other direction. The rule of thumb wants monthly rent at or above 1% of the purchase price, and this deal lands at 0.9%. It is a screening shortcut rather than a law, and in a lot of 2026 markets almost nothing clears it — but here it flagged the same weakness the DSCR did, one line earlier and with far less arithmetic.

What rent would this deal need to reach 1.15?

About $2,002 a month instead of $1,800, working backwards from the regulated 1.15 floor through operating expenses and vacancy to the rent line.

Nothing in this step is a benchmark or an estimate — it is the same chain of formulas run in reverse from two figures already in the table. Operating expenses are not stated as their own cell, but they are recoverable: effective gross income minus NOI, or 20,520 – 12,384 = 8,136.

REQUIRED NOI    = annual debt service x target DSCR
                = 12,773.81 x 1.15
                = 14,689.88          (a gap of 2,305.88 over the seeded 12,384)

REQUIRED EGI    = required NOI + operating expenses
                = 14,689.88 + 8,136
                = 22,825.88

REQUIRED GROSS  = required EGI / (1 - 0.05 vacancy)
                = 22,825.88 / 0.95
                = 24,027.24 a year

REQUIRED RENT   = 24,027.24 / 12
                = 2,002.27 a month   (vs 1,800 seeded)

At a 1.25 target the same chain gives 2,114.32 a month.

One honest caveat on that arithmetic: it holds operating expenses flat at $8,136. In a real sheet the management fee is a percentage of collected income, so raising the rent raises that line slightly and the true required rent sits a little above $2,002. The analyzer recalculates it properly because management is entered as a percentage; the version above is the hand-arithmetic that shows you where the answer comes from.

Notice how far that is from the break-even rent in F25. $1,843.90 is the rent at which cash flow reaches zero — the 1.0 line, roughly. Getting from break-even to a 1.15 lender cushion costs another $158 a month on top of that, which is the part people miss when they say a deal “almost works.”

What actually moves DSCR?

Four inputs, and only two of them are under your control on any given Tuesday: rent, operating expenses, the loan balance and the interest rate.

  • Rent and vacancy move the top of the fraction. Every dollar of rent is worth 95 cents of EGI at a 5% vacancy assumption, and less than that after the expense ratio takes its share.
  • Operating expenses move the top of the fraction the other way, dollar for dollar. In this deal they eat $8,136 of $20,520 — about 40 cents of every collected dollar, before the mortgage.
  • Loan amount moves the bottom. A smaller loan means a smaller PMT, so a larger down payment mechanically raises DSCR without changing anything about the building.
  • Interest rate and term move the bottom hardest, because PMT is not linear. The same $160,000 at a different rate produces a different F8, and F8 times twelve is the entire denominator.

This is the whole argument for running the ratio on a sheet rather than in your head. Four inputs and a PMT function is more arithmetic than anyone does accurately standing in a driveway, and the answer changes sign on differences of thirty dollars a month.

Common questions

Is DSCR the same thing as cash flow?

No — they are the same subtraction expressed two ways. Cash flow is NOI minus debt service ($12,384 – $12,773.81 = -$389.81 in F19); DSCR is NOI divided by debt service (0.97 in F23). A DSCR below 1.0 and a negative cash flow always appear together, because they are the same shortfall as a ratio and as a dollar figure. The ratio is what a lender reads, because it is comparable across properties of any size.

Does DSCR use gross rent or net operating income?

Net operating income. Gross scheduled income here is $21,600 (F11) and NOI is $12,384 (F15) — using the gross figure would produce a DSCR of 1.69 on a deal that is actually short $32.48 a month. NOI is taken after vacancy, maintenance, CapEx reserve, management, taxes and insurance, and before the mortgage.

Does a bigger down payment fix a DSCR below 1.0?

Mechanically, yes: DSCR’s denominator is the loan payment, so a smaller loan means a smaller PMT and a higher ratio, with the property’s income untouched. That is arithmetic, not a recommendation — the same move raises the total cash in the deal (F7 is already $51,000 here) and so lowers the cash-on-cash return on the money you put in. The analyzer shows both numbers at once so the trade is visible rather than assumed.

Run it on your own numbers

The arithmetic above is the part that gets skipped, so it is the part this site publishes for free. The free rental property deal analyzer runs the whole chain — vacancy, NOI, PMT, DSCR, cap rate and break-even rent — from six inputs, and the seeded figures above are what it loads with, so you can reproduce every number on this page before you type your own.

The Rental Property Deal Analyzer workbook is the version you keep — Google Sheets and Excel in one purchase, $19.99, every formula machine-checked before it ships. Fifteen figures in it were rebuilt in code from the same seed inputs and compared line by line; one disagreement would have stopped the release, and an excerpt of that ledger sits on the product page.

Rental Property Deal Analyzer

Run the numbers from this guide yourself — free, in the browser, no sign-up. Keep the full workbook if it earns its place.

Educational estimates only. These calculators and workbooks do the arithmetic on the figures you enter; they are general-purpose tools, not financial, investment, tax, legal, lending, insurance or construction advice, and no result is a quote, an offer, or a guarantee of any outcome. Results depend entirely on your inputs and assumptions. Verify anything you intend to rely on with a licensed professional — a CPA, attorney, lender, licensed contractor, or your own agent. WorkbookBarn and Marcos Gil accept no liability for decisions made using these tools. Marcos Gil is a licensed Kentucky real estate agent (License No. 296259) and is not a lender, CPA or attorney.

LineCellFigure
Loan amountF5$160,000
Down paymentF6$40,000
Total cash in the dealF7$51,000
Monthly principal + interest (PMT)F8$1,064.48
Gross scheduled incomeF11$21,600
Effective gross income after 5% vacancyF13$20,520
Net operating incomeF15$12,384
Annual debt serviceF16$12,773.81
Annual cash flowF19-$389.81
Monthly cash flowF20-$32.48
Cap rateF216.2%
Cash-on-cashF22-0.01
DSCRF230.97
1% ruleF240.9%
Break-even rentF25$1,843.90