The Ledger · Money
How much should I save each month? Work backwards from the goal
Work backwards: what is still missing on each goal, divided by the whole calendar months until its date — then check whether every goal together adds up to more than you can actually put aside.
Work it backwards, not forwards. For any one goal the monthly number is (target − what you have saved) ÷ the whole calendar months until the date — and the only answer that matters is what you get when you run that on every goal at once and compare the total to what you can actually put aside. A percentage of your income is a rule of thumb; this is arithmetic.
So how much should I save each month?
Whatever is still missing on each goal divided by the months left until you need it, added up across every goal, and then checked against what you can spare.
That is a different question from the one almost every article on this search answers. The usual answer starts from your paycheck and takes a slice of it — save 20%, or follow 50/30/20. Those are budgeting heuristics, and they are fine as a starting discipline, but they cannot tell you whether you are going to have the money in April. They are income-side answers to a goal-side problem.
The goal-side version needs four inputs per goal and nothing else: what it costs, what you have put aside so far, when you need it, and what you are currently putting in each month. Everything after that is division.
Why does every other answer come back as a percentage?
Because a percentage is the only answer that can be written without knowing anything about you, which is exactly what makes it a weak answer.
It is also worth knowing how far the common rule sits from what households collectively do. The U.S. Bureau of Economic Analysis publishes the personal saving rate — defined on its own page as personal saving as a percentage of disposable personal income — and on the Bureau of Economic Analysis page as read on 21 October 2026, the figure given for August 2026 is 4.1%, with 4.6% for July 2026 and 4.4% for June 2026.
Set that next to “save 20% of your income” and the gap is roughly fivefold. That does not make the 20% rule wrong as an aspiration, but it does explain why the rule tends to bounce: it is a target with no mechanism attached and no date to be measured against. A goal with a date fails loudly in month two. A percentage target just quietly stops happening.
The same page answers the novelty rules that show up alongside this search. The “$27.39 a day” rule is not a rule at all, it is one division done in reverse: $10,000 spread over 365 days is $27.3973 a day. The arithmetic below is the general case of it, and it works for any amount and any date rather than just $10,000 and a year.
What is the formula for how much to save each month?
Four lines per goal, and the hardest one is a date subtraction. This is the arithmetic the free Savings Goal Tracker calculator actually runs in your browser, written out:
Still to save     = MAX(0, Target - Saved)
Months left       = MAX(0, (YEAR(Date) - YEAR(TODAY())) * 12
                            + MONTH(Date) - MONTH(TODAY()))
Needed each month = Still to save / MAX(1, Months left)
Short by          = Needed each month - Going in now

Percent funded    = Saved / Target
Status            = IF(Still to save <= 0, "Funded",
                      IF(Going in now >= Needed each month,
                         "On track", "Behind"))
Three details in there are doing real work. MAX(0, …) on the first line stops an overfunded goal from reporting a negative requirement and dragging the total down. MAX(1, …) on the third line is a divide-by-zero guard: when the date arrives this month, the whole remaining balance is due this month rather than producing an error. And the months count is deliberately whole calendar months, not days divided by 30.44, because you save on a monthly cycle and a part-month you cannot contribute in is not a month you have.
Run it on the question people actually type — $20,000 in twelve months from a standing start — and it returns $20,000 ÷ 12 = $1,666.67 a month. No interest, no assumptions, no account type. That is the number, and the useful part is that you now know it before you promise it to yourself.
What does it look like with real numbers?
Here is one goal from the workbook’s test ledger, every figure independently verified in code before release.
| Focus goal (THE PLAN sheet) | Value | Where it comes from |
|---|---|---|
| Target amount | $12,000 | typed in |
| Saved so far | $7,400 | typed in |
| Percent funded | 61.7% | 7,400 ÷ 12,000 |
| Still to save | $4,600 | 12,000 − 7,400 |
| Months until the date | 10 | calendar months to the date |
| Needed each month | $460 | 4,600 ÷ 10 |
| Needed each month, counting interest | $428.48 | PMT at the sheet’s 4% default |
| Going in each month today | $350 | typed in |
| Short by, each month | $110 | 460 − 350 |
Read the bottom row rather than the top one. “61.7% funded” feels like progress and tells you nothing about whether you will make it. Short by $110 a month is the whole answer in one number: this goal is not short of commitment, it is short of one hundred and ten dollars a month, and that is a thing you can go and solve.
Does interest change how much you need to save each month?
Yes, but less than most people expect over a short horizon — on this ledger it moves $460 down to $428.48, a difference of $31.52 a month.
The simple division assumes the money sits in a shoebox. The interest-aware version solves for the deposit that grows an existing balance to the target over the same number of months, which in spreadsheet terms is a payment function:
Needed each month, with interest
  = MAX(0, -PMT(APY / 12, MAX(1, Months left), -Saved, Target))

APY / 12   the monthly periodic rate
-Saved     the balance already working, entered as a negative
Target     the future value you want to arrive at
Two things follow from the shape of that formula. The benefit scales with time, not with the deposit — over ten months 4% buys you $31.52 a month, and over ten years the same rate rewrites the problem entirely. And it is the $7,400 already saved doing most of the lifting here, not the new deposits, because that balance compounds for the full ten months while each deposit only earns for the months that follow it.
Which number you plan against is a judgement call, and the conservative one is the simple division. It assumes nothing about the rate holding, and if the rate does hold you arrive early. Both are on the sheet, one line apart, on purpose.
What happens when you have ten goals and not one?
This is where the percentage answers fall apart completely, and it is the only question in this article that a single-goal calculator cannot answer.
Each goal, read on its own, looks survivable. Add the per-goal monthly requirements together and compare that total to what you can actually put aside, and you get a feasibility test rather than a wish list. On the same test ledger, with ten goals running at once:
| All goals together (THE PLAN sheet) | Value |
|---|---|
| Goals tracked | 10 |
| Everything aimed at | $77,600 |
| Saved so far | $26,300 |
| Percent funded overall | 33.9% |
| Still to save | $51,300 |
| Every goal on time needs, per month | $3,160.93 |
| Going in each month today | $2,350 |
| Left over each month (budget − requirement) | −$660.93 |
| Goals fully funded | 1 |
| Goals behind | 7 |
The row that decides everything is the negative one. The plan as written needs $3,160.93 a month, the budget line will not carry it, and the shortfall is −$660.93. Seven of the ten goals are already behind. No amount of discipline fixes that, because it is not a discipline problem — the ten dates are collectively impossible, and that was true the day they were written down.
That single negative number is worth more than every percentage rule combined, because it arrives early, while the dates are still movable.
What do you do when the total is more than you can save?
There are only four levers in the formula, and once you can see it written out it is obvious which ones exist: add per month, add a lump, move the date, or drop a goal.
The arithmetic for the first two is the same division run forward instead of backward:
Months at today's pace = Still to save / Going in now
Months with the extra  = MAX(0, Still to save - One-off boost)
                           / (Going in now + Extra per month)
Months earlier         = Months at today's pace - Months with the extra
Months to spare        = Months left - Months with the extra
On the focus goal above, the ledger runs that what-if at $150 more a month plus a one-off $1,000, taking the monthly amount from $350 to $500 and the balance to 70.0% funded. The result: 13.14 months to finish at today’s pace becomes 7.20 months — 5.94 months earlier, and 2.80 months to spare against a date that was going to be missed.
Notice the asymmetry hiding in the third line. The $1,000 one-off and the $150 a month do not contribute equally — the lump comes off the numerator once, while the raised monthly amount divides into the remainder every month from now until the end. On a short horizon the lump wins on optics and the monthly increase wins on arithmetic.
The third lever, moving the date, is the one people resist and the one the formula likes most, because months left is in the denominator: push the date out and the monthly requirement falls for free. Dropping or shrinking a goal is the fourth, and in a ten-goal plan running at −$660.93 it is usually the honest one. The sheet also runs the plain forecast — keep going at exactly today’s $2,350 a month for twelve more months and the ledger lands at $54,500 saved, or 70.2% funded overall, which is the number to compare any plan against before deciding whether the plan was worth the trouble.
Does a biweekly paycheck change the monthly number?
Not the requirement, but it changes how reliably you can meet it, because a biweekly cycle does not pay twice a month.
Twenty-six paychecks a year divided by twelve months is 2.1667 per month, so two months in every year carry a third paycheck and the other ten carry two. If you set your contribution as “half the monthly requirement, every payday”, you will overshoot by a full extra contribution twice a year. If you set it as “the monthly requirement, on the first payday of the month”, the ten two-paycheck months are the ones that hurt. Both are fine, as long as you picked one — the arithmetic of that cycle is worked through in why a biweekly pay cycle produces 26 paychecks rather than 24.
One related piece of arithmetic on this site: how many months of expenses an emergency fund has to cover — which is the one goal on most lists that has no date attached to it, and therefore has to be sized rather than scheduled.
Running it on your own numbers
The free calculator on this site runs the whole chain above in the browser, including the multi-goal total and the negative row. The Savings Goal Tracker workbook is the same model as a file you keep — forty goal rows, the dashboard, the what-if block — in Google Sheets and Excel, built with an older universal formula vocabulary so it imports into free Google Sheets with no add-ons. Every figure quoted in this guide came from its release ledger: 48 figures rebuilt independently in code from the same seed inputs and compared one by one, where a single disagreement stops the release.
Frequently asked questions
How is “needed each month” worked out?
What is still missing, divided by the number of whole calendar months between now and your date. It ignores interest on purpose so you can check it in your head. The version with interest sits on the line directly underneath, and over a year or two the difference is usually small.
Why is a box red the first time I open it?
Because the example person wants more than they can put aside each month. That is the normal starting position and the tracker is built to say so out loud rather than average it away. Type your own numbers in and it recalculates.
Does it work in free Google Sheets?
Yes. File > Import > Upload > choose the file > Replace spreadsheet. Every formula was written to run in Google Sheets as well as Excel — no XLOOKUP, no LAMBDA, no add-ons, no account needed.
What if a goal has no date?
Then months left is not defined and the division has no answer, which is a real result rather than a bug. A goal without a date cannot be scheduled, only sized — so either give it a date and let it compete with the others for the monthly budget, or treat it as a balance to maintain rather than a target to reach.
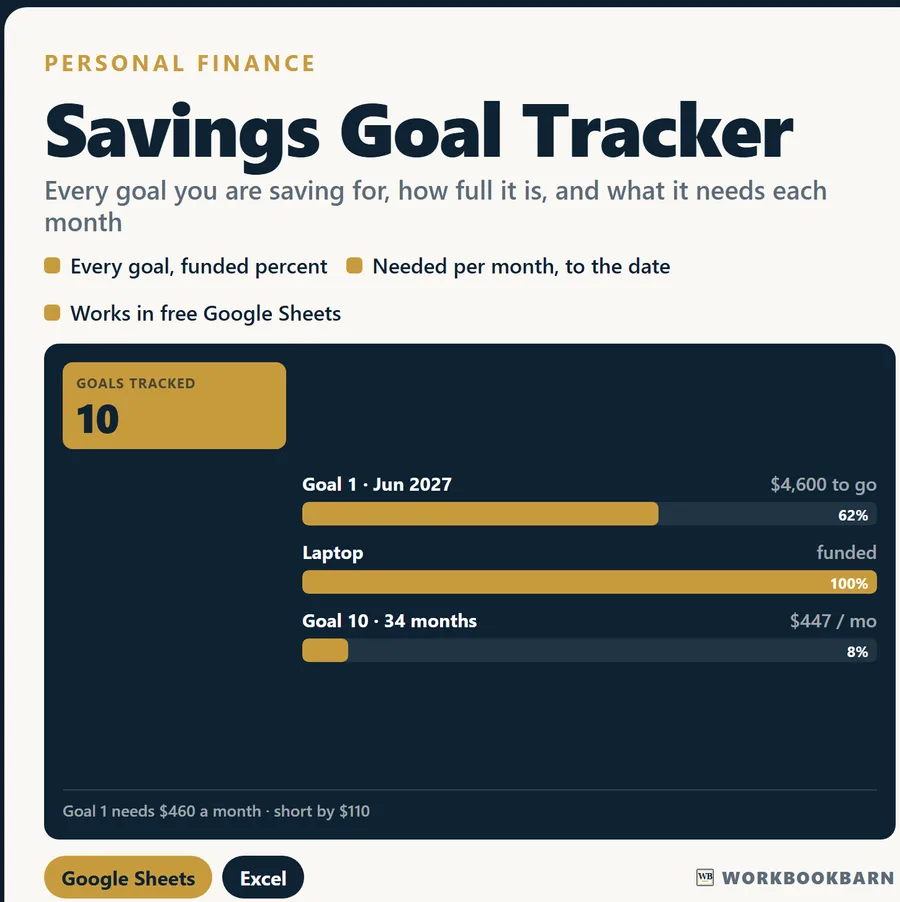
Savings Goal Tracker
Run the numbers from this guide yourself — free, in the browser, no sign-up. Keep the full workbook if it earns its place.
Educational estimates only. These calculators and workbooks do the arithmetic on the figures you enter; they are general-purpose tools, not financial, investment, tax, legal, lending, insurance or construction advice, and no result is a quote, an offer, or a guarantee of any outcome. Results depend entirely on your inputs and assumptions. Verify anything you intend to rely on with a licensed professional — a CPA, attorney, lender, licensed contractor, or your own agent. WorkbookBarn and Marcos Gil accept no liability for decisions made using these tools. Marcos Gil is a licensed Kentucky real estate agent (License No. 296259) and is not a lender, CPA or attorney.