The Ledger · Property
Cap rate explained, with a worked example
Cap rate is net operating income divided by the purchase price - no mortgage, no depreciation - which is why a 6.2% cap rate can still lose $32.48 a month.
Cap rate is net operating income divided by the purchase price, and nothing else — no mortgage, no depreciation, no income tax. It tells you what the building earns, which is why a perfectly respectable 6.2% cap rate can still hand you a property that loses money every month once the loan payment lands. Below is the formula, a full worked example from the Rental Deal Analyzer’s own tested figures, and the free calculator that runs it.
By Marcos Gil — licensed Kentucky REALTOR and Richmond roofing company owner.
What is the cap rate formula?
Cap rate equals net operating income divided by the purchase price or market value. Both figures are annual, and debt never appears in either one.
Cap rate = Net operating income (annual) / Purchase price

  Effective gross income = Gross scheduled rent - vacancy allowance
  Net operating income   = Effective gross income - operating expenses
  (operating expenses EXCLUDE mortgage principal and interest,
   capital improvements, depreciation and income tax)
The reason debt is excluded is the whole point of the metric: two buyers can pay cash or borrow 80%, and the building’s earning power does not change. Cap rate is the number that lets you line up a duplex you would finance against a fourplex your neighbour paid cash for and compare the assets rather than the loan officers.
What counts as an operating expense, and does the mortgage go in?
Operating expenses are the recurring costs of running the building: taxes, insurance, management, maintenance, utilities you pay, and turnover. The mortgage is not one of them.
This is the single most common place a cap rate calculation goes wrong, and it goes wrong in both directions. Put the loan payment into operating expenses and every financed property looks like a disaster. Leave out management because you self-manage, and you have quietly priced your own labour at zero — then you sell the building to someone who has to hire a manager, and the cap rate you bragged about evaporates.
Vacancy is the other silent line. It comes off the top, before expenses, as a percentage of gross scheduled rent — not because the unit is empty today but because over a holding period it will be. For scale: the U.S. Census Bureau reported a national rental vacancy rate of 7.3% in the second quarter of 2026 (released July 28, 2026). A 5% allowance, which is what the worked example below uses, is on the tighter side of that.
What does a 6% cap rate actually mean?
A 6% cap rate means the building’s net operating income equals 6% of what you paid, so an all-cash buyer recovers the purchase price from operations in roughly 17 years.
Flip the formula and it becomes a pricing tool instead of a scoring tool. Price equals net operating income divided by cap rate, so suppose comparable buildings in the neighbourhood were trading at 7% — an assumption to illustrate the arithmetic, not a measured market figure. The same $12,384 of NOI would imply a price near $177,000. Pay $200,000 for the same income stream and you have bought at a 6.2% cap — you paid more per dollar of income than the market did. That is not automatically a mistake, but it is a decision, and the cap rate is what makes it visible.
Can a healthy cap rate still lose money every month?
Yes — routinely. Cap rate ignores the loan, so a 6.2% cap property with an expensive mortgage can produce positive NOI and negative cash flow at the same time.
Here is the whole thing worked through, using the seed figures the Rental Deal Analyzer ships with — the same numbers the workbook is tested against, cell by cell, on the Analyzer tab.
| Line | Figure |
|---|---|
| Loan amount | $160,000 |
| Down payment | $40,000 |
| Purchase price (loan + down) | $200,000 |
| Total cash in deal | $51,000 |
| Gross scheduled income | $21,600 |
| Effective gross income (after 5% vacancy) | $20,520 |
| Net operating income | $12,384 |
| Monthly P+I (via PMT) | $1,064.48 |
| Annual debt service | $12,773.81 |
| Cap rate | 6.2% |
| DSCR | 0.97 |
| Annual cash flow | −$389.81 |
| Monthly cash flow | −$32.48 |
| Cash-on-cash | −0.01 |
| 1% rule | 0.9% |
| Break-even rent | $1,843.90 |
Walk it: $21,600 of scheduled rent, less the 5% vacancy allowance, gives $20,520 of effective gross income. Net operating income comes out at $12,384, so the difference — $8,136 — is what operating expenses consumed. Divide by the $200,000 price and you get 6.192%, which rounds to the 6.2% cap rate the sheet reports. Every line so far is fine.
Then the loan shows up. Annual debt service is $12,773.81 against $12,384 of NOI, so the property services 97 cents of debt for every dollar owed — a DSCR of 0.97 — and the annual cash flow is −$389.81, or −$32.48 a month. On $51,000 of cash in the deal, cash-on-cash comes back at −0.01. The building is not the problem. The capital stack is.
That $1,843.90 break-even rent line is the one worth keeping. It is the rent at which this deal stops bleeding — about $44 a month above the $1,800 the seed rents actually collect. That is the real question in front of you, and it is a rent-comp question, not a cap-rate question.
So what is a good cap rate?
There is no universal good number — cap rate is a price, and prices are local. The useful comparison is against what similar buildings in the same submarket actually traded for this year.
A high cap rate is not a prize; it is usually the market pricing in something — a rougher street, older systems, thinner tenant demand, a roof with three years left in it. A low cap rate is not automatically an overpay either; it is often what stable demand costs. The honest use of the metric is narrow and it is enough: cap rate screens, it does not decide. Screen with cap rate, then check whether the deal survives the loan with DSCR and cash-on-cash, then go look at the building.
If the DSCR side of that is unfamiliar, start with what a good DSCR is for a rental property — 0.97 in the example above is exactly the number a lender declines.
How do you run this on your own numbers?
Type six figures — price, loan, rent, taxes, insurance, and expenses — and the same chain runs itself, from effective gross income down to break-even rent.
The free cap rate and deal calculator runs the whole sequence in the browser with nothing to download. The Rental Deal Analyzer workbook is the same arithmetic in a spreadsheet you keep — Google Sheets or Excel — so you can save a file per property, keep the deals you walked away from, and see the pattern in what you rejected. Every figure in the table above is a tested cell in that workbook, not an illustration.
Cap rate FAQ
Does a bigger down payment improve the cap rate?
No. Cap rate is net operating income over purchase price, and neither figure moves when you change the loan. A bigger down payment improves cash flow, DSCR and monthly survival — in the worked example it is what would turn −$32.48 a month positive — but the cap rate stays 6.2%.
Why is the seller’s cap rate higher than the one I calculate?
Almost always because their net operating income is built on a pro forma rather than on operations: full occupancy with no vacancy allowance, no management fee, no maintenance reserve, and sometimes next year’s rents instead of this year’s leases. Rebuild NOI from the actual rent roll and the actual tax bill and the number comes down.
Is cap rate or cash-on-cash the better number?
They answer different questions. Cap rate scores the building independent of financing, which is what makes it comparable across properties. Cash-on-cash scores your particular deal, loan included. The worked example shows why you need both: a 6.2% cap rate sitting on a −0.01 cash-on-cash return.
Do capital improvements go into operating expenses?
No — a new roof or a full HVAC replacement is a capital item, not an operating expense, so it sits outside NOI and outside the cap rate. That is a known blind spot in the metric rather than a loophole: budget those separately, because the cap rate will never warn you about them.
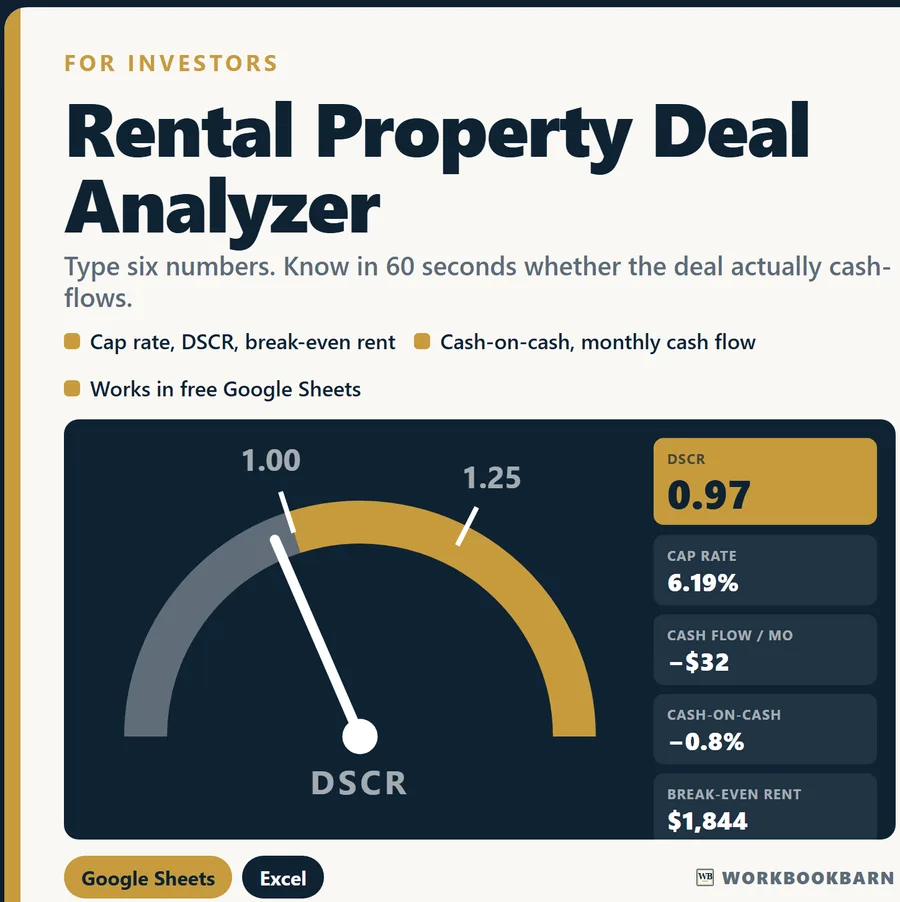
Rental Property Deal Analyzer
Run the numbers from this guide yourself — free, in the browser, no sign-up. Keep the full workbook if it earns its place.
Educational estimates only. These calculators and workbooks do the arithmetic on the figures you enter; they are general-purpose tools, not financial, investment, tax, legal, lending, insurance or construction advice, and no result is a quote, an offer, or a guarantee of any outcome. Results depend entirely on your inputs and assumptions. Verify anything you intend to rely on with a licensed professional — a CPA, attorney, lender, licensed contractor, or your own agent. WorkbookBarn and Marcos Gil accept no liability for decisions made using these tools. Marcos Gil is a licensed Kentucky real estate agent (License No. 296259) and is not a lender, CPA or attorney.