The Ledger · Property
Cash on Cash Return: the Formula and a Worked Example
Cash on cash return is annual pre-tax cash flow divided by the total cash in the deal — not the down payment — and here it is worked through on a seed deal that comes out negative.
Cash on cash return is one division: the cash the property actually puts in your pocket in a year, divided by the cash you actually put into the deal. It is not a yield on the purchase price and it is not a return on equity — it is a return on your money, which is why it is the number that changes the most when the financing changes. Below is the formula, the two inputs almost everyone gets wrong, and a worked example from this site’s Rental Property Deal Analyzer in which the answer comes out negative.
What is the cash on cash return formula?
Annual pre-tax cash flow divided by the total cash in the deal. Both numbers are cash, both are first-year numbers, and neither includes appreciation or principal paydown.
cash-on-cash = annual pre-tax cash flow / total cash in deal

where  annual pre-tax cash flow = net operating income - annual debt service
and    total cash in deal       = down payment + closing costs + up-front work + reserves
That is the whole calculation. The difficulty is never the division — it is that both inputs are assembled from other numbers, and a pro forma can quietly shrink either one. Get the two inputs honest and the metric is almost impossible to argue with; get them optimistic and you have a decimal that flatters a deal you should have walked away from.
Notice what is deliberately missing. Appreciation is missing, because it is not cash. Principal paydown is missing, because it is equity, not cash — your mortgage payment takes it out of your pocket and the sheet charges you for all of it. Tax effects are missing, which is what “pre-tax” means. Cash on cash answers one question only: for every dollar I handed over at closing, how many cents came back this year?
What counts as the cash in the deal?
Everything you hand over to own and stabilise the property, not just the down payment — closing costs, the up-front work, and the reserves you fund on day one.
This is the input that moves the answer most, and the one a listing pro forma is most likely to understate, because the down payment is the only part of it that has a tidy, quotable number. Closing costs are real cash. The Consumer Financial Protection Bureau’s answer on mortgage closing fees — read on 23 October 2026, page last modified 13 September 2024 — lists appraisal fees, tax service provider fees, title insurance, government taxes, and prepaid expenses such as property taxes, homeowners insurance and interest until the first payment is due among the common charges at closing (Consumer Financial Protection Bureau). Every one of those leaves your account in the same week the deed does.
In the Analyzer’s seed deal the difference between the two numbers is stark. The down payment cell reports $40,000. The total-cash-in-deal cell reports $51,000. The extra $11,000 is closing costs and the up-front work — 27.5% more cash than the down payment alone, and dividing by the wrong one of those two figures changes the answer by more than a quarter before you have made a single optimistic assumption about rent.
Where does the annual cash flow number come from?
Net operating income minus annual debt service. Net operating income is itself gross rent minus a vacancy allowance minus every operating expense — and not minus the mortgage.
The chain below is the Analyzer’s seed deal, every figure quoted from the release ledger for the Rental Property Deal Analyzer. The property is a $200,000 purchase — a $160,000 loan plus the $40,000 down payment — scheduled at $1,800 a month in rent.
| Line | Cell | Figure |
|---|---|---|
| Loan amount | F5 | $160,000 |
| Down payment | F6 | $40,000 |
| Total cash in deal | F7 | $51,000 |
| Monthly P+I via PMT | F8 | $1,064.48 |
| Gross scheduled income | F11 | $21,600 |
| Effective gross income after 5% vacancy | F13 | $20,520 |
| Net operating income | F15 | $12,384 |
| Annual debt service | F16 | $12,773.81 |
| Annual cash flow | F19 | −$389.81 |
| Monthly cash flow | F20 | −$32.48 |
| Cap rate | F21 | 6.2% |
| Cash-on-cash | F22 | −0.01 |
| DSCR | F23 | 0.97 |
| 1% rule | F24 | 0.9% |
| Break-even rent | F25 | $1,843.90 |
Read it top to bottom and the metric stops being abstract. Gross scheduled income is $21,600, which is twelve months at full asking rent — a number no landlord actually collects. A 5% vacancy allowance takes it to $20,520 of effective gross income. Operating expenses — taxes, insurance, maintenance, capital reserves, management — account for the $8,136 between that and the $12,384 of net operating income, and the mortgage is not among them. The mortgage enters one line lower, as $12,773.81 of annual debt service.
One detail in that table is worth a sentence, because it is the kind of thing that makes people think a spreadsheet is broken. Multiply the displayed monthly payment of $1,064.48 by twelve and you get $12,773.76 — five cents under the $12,773.81 annual debt service line. The annual figure is built from the unrounded PMT result; the monthly figure is rounded for the eye. That is display rounding, not a mistake, and it is why you check an annual line against an annual line.
What does the worked example come out at?
Negative. The seed deal produces −$389.81 of annual cash flow on $51,000 of cash in, and the Analyzer’s cash-on-cash cell reports −0.01.
The arithmetic: net operating income of $12,384 minus annual debt service of $12,773.81 leaves −$389.81 for the year, which is the −$32.48 a month on the line below it. Divide −$389.81 by the $51,000 of total cash in the deal and you get −0.0076; the cash-on-cash cell reports that rounded to −0.01.
Divide by the down payment instead — the shortcut that feels close enough — and you get −0.0097. Both answers are negative here, so the mistake is survivable in this particular deal. It is not survivable in a thin positive one, where dividing by $40,000 instead of $51,000 inflates the answer by 27.5% and turns a result you would decline into a result you would accept.
Every example on the internet seems to come out positive, which is a selection effect, not a market condition. This seed deal is deliberately a near miss, and the line that tells you why in one number is the break-even rent of $1,843.90 against the $1,800 a month actually scheduled: the property is roughly $44 a month short of paying for itself, and no amount of enthusiasm closes that gap.
What is a good cash on cash return?
There is no universal threshold, and we are not going to invent one. The honest version is a comparison you make yourself against what the same cash would do elsewhere.
Thresholds get quoted confidently and sourced rarely, so treat any specific percentage you see — including ones you may have seen on this subject elsewhere — as that writer’s preference rather than a standard. What makes the metric useful is not the bar, it is that it is comparable: the same division on three candidate properties, run with the same honesty about vacancy and reserves, ranks them in an order that cap rate alone cannot.
Two things are worth knowing about the shape of the number rather than its size. First, cash on cash is a first-year number, and the first year is usually the worst one, because rent moves and the payment on a fixed-rate loan does not. Second, the number is not a property characteristic at all — the same building with a larger down payment has less debt service, more cash flow, more cash in the deal, and an entirely different cash-on-cash. That sensitivity to financing is the metric’s whole point, and also the reason it cannot be compared across deals financed differently without saying so.
None of this is investment advice, and nothing here is a recommendation to buy, refinance or pass on anything. It is an explanation of an arithmetic test you can run yourself before anyone else runs it for you.
Cash on cash, cap rate or DSCR — which one answers what?
Three different questions off the same deal: cap rate asks about the property, cash on cash asks about your cash, DSCR asks whether the lender gets paid.
- Cap rate — 6.2% here. Net operating income over purchase price. It ignores the loan entirely, which makes it the right tool for comparing two buildings and the wrong tool for comparing two offers on the same building.
- Cash-on-cash — −0.01 here. Cash flow over cash in. It is the only one of the three that knows how much of your own money is at risk.
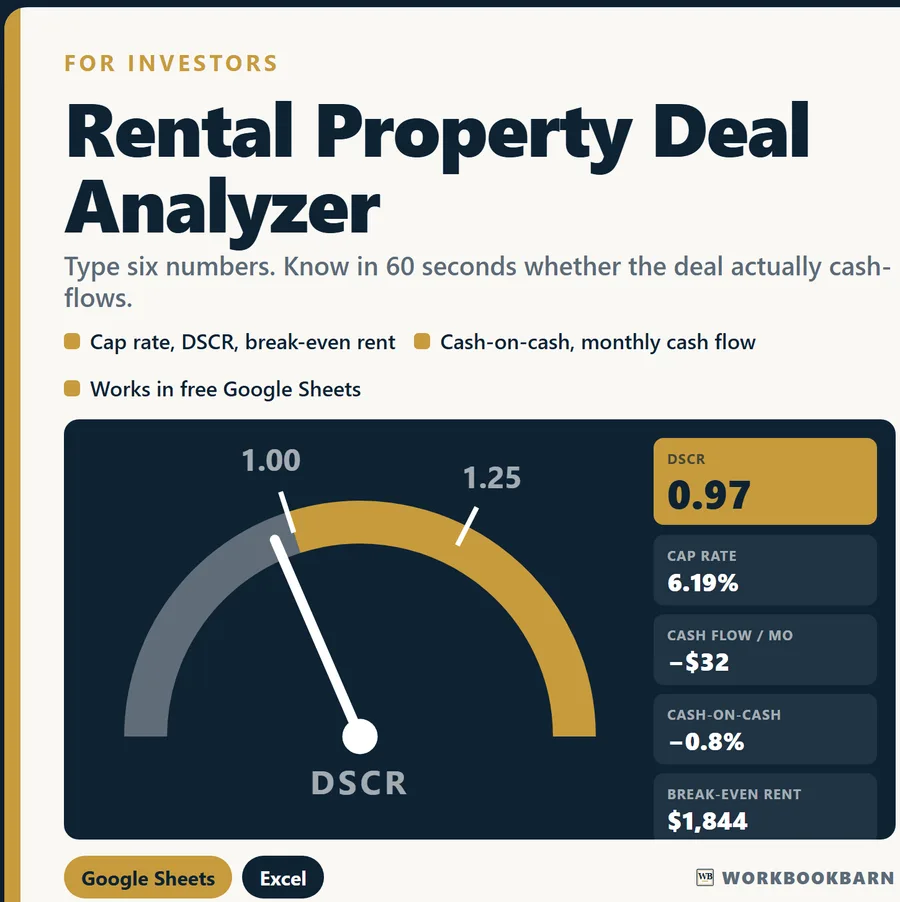
- DSCR — 0.97 here. Net operating income over annual debt service. Below 1.00 the property does not earn its own mortgage payment, which is exactly what the negative cash flow above is saying in a different unit.
- The 1% rule — 0.9% here. Monthly rent as a percentage of price. A sorting shortcut for a long list, not a verdict on any one deal.
They agree in this seed deal, and that agreement is informative: a 6.2% cap rate looks respectable on its own, and the only reason you can see the problem is that two of the other three metrics know about the loan. If you want the full arithmetic on the other two, there is a worked example for the cap rate on this same model and a separate guide on what a good DSCR actually means to a lender.
Why is my cash on cash lower than the listing’s pro forma?
Usually because the pro forma set vacancy, maintenance, capital reserves and management to zero, and because it divided by the down payment rather than all the cash.
A roof and an HVAC unit are not optional expenses; they are expenses you have not paid yet. The difference between $21,600 of gross scheduled income and $12,384 of net operating income in the table above is what charging yourself honestly for those things costs on one small property. Strip the vacancy allowance and the reserves out and the same building shows a cheerful positive number that will be contradicted by your bank statement in month eight.
The self-management version of the same trap is worth naming. If you intend to manage the property yourself, run the sheet with a management expense in it anyway. A deal that only works because you work it for free is a job, not an investment — and if you buy it after the number still clears, that management line becomes your paycheck instead of a stranger’s.
I run a roofing company in Kentucky and hold a real-estate licence here, which means I spend part of my week pricing the exact expense line most pro formas set to zero. The reserve line is not padding. It is a bill with a date you do not know yet.
Running it on your own numbers
The free cash-on-cash and deal calculator on this site runs the whole chain above in the browser — the vacancy haircut, the operating expenses, the PMT payment, cash on cash, cap rate, DSCR, the 1% rule and the break-even rent — from six inputs. The Rental Property Deal Analyzer workbook is the same model as a file you keep, in Google Sheets and Excel, built with an older universal formula vocabulary so it imports into free Google Sheets with no add-ons. Every figure quoted in this guide came from its release ledger: 15 figures rebuilt independently in code from the same seed inputs and compared one by one, where a single disagreement stops the release.
Frequently asked questions
Can cash on cash return be negative?
Yes, and the seed deal above is negative: −$389.81 of annual cash flow on $51,000 of cash in the deal, reported as −0.01. A negative result simply means the property collected less cash in the year than it spent, including the mortgage. It is a result, not an error — and it is the result a sheet that charges honestly for vacancy and reserves will show you more often than a listing pro forma will.
Should I use the down payment or the total cash in the deal?
The total cash in the deal. In the seed figures that is $51,000 rather than the $40,000 down payment — closing costs and the up-front work make up the rest. Using the down payment overstates the answer by 27.5% in this deal, and the overstatement grows with every dollar of rehab.
Is cash on cash the same as ROI?
No. Cash on cash counts only cash, only in the first year, and only before tax — so it excludes appreciation, principal paydown and any tax effect. A full return-on-investment figure tries to include those, which makes it a forecast with assumptions in it. Cash on cash is deliberately the narrower, checkable number.
Does it work in free Google Sheets?
Yes. File > Import > Upload > choose the file > Replace spreadsheet. Every formula was written to run in Google Sheets as well as Excel — no XLOOKUP, no LAMBDA, no add-ons, no account needed. The PMT function the debt-service line uses is supported in both.
Rental Property Deal Analyzer
Run the numbers from this guide yourself — free, in the browser, no sign-up. Keep the full workbook if it earns its place.
Educational estimates only. These calculators and workbooks do the arithmetic on the figures you enter; they are general-purpose tools, not financial, investment, tax, legal, lending, insurance or construction advice, and no result is a quote, an offer, or a guarantee of any outcome. Results depend entirely on your inputs and assumptions. Verify anything you intend to rely on with a licensed professional — a CPA, attorney, lender, licensed contractor, or your own agent. WorkbookBarn and Marcos Gil accept no liability for decisions made using these tools. Marcos Gil is a licensed Kentucky real estate agent (License No. 296259) and is not a lender, CPA or attorney.